HYDROGEOPHYSICS
ELECTRICAL RESISTIVITY TOMOGRAPHY
Methodology
2D electrical resistivity tomography (ERT) was used to achieve two main objectives: (1) Identify and characterize the subsurface geology of the pond; and (2) Identify locations and quantify the magnitude of subsurface water exchange between the Salt Pond and the ocean.
Electrical geophysical methods are used to map subsurface distributions of electrical resistivity, a property that quantifies how strongly the rock opposes the flow of electrical current. The idea is that, depending on the type of soil/rock and the fluid properties and distribution in the subsurface, current will flow differently. For example, dry rocks will typically have a higher electrical resistivity (harder for the current to flow), than the exact same rocks containing groundwater. The ERT measurement system actively injects a small current (~ 0.5 A; exact value depends on contact resistance and subsurface resistivity), which flows through the Earth in a way that is controlled by the subsurface properties. Differences in electrical potential are subsequently measured at several electrical receiver pairs (electrodes) placed at various locations on the Earth’s surface.
Multiple clay layers are visible in and around the pond area and underneath a surficial reddish clay is a gray to black clay. Based on our observations, the thickness of the clay in the pond area varies from centimeters to ~0.5m. Such clay layers provide the optimal geologic setting for the salt making practice due to their low hydraulic permeability that effectively seals the pond. Therefore, to address objective #1, we focused on characterizing the clay layers, their thickness and variability in thickness, heterogeneity in composition, and slope of the layers. These parameters help characterize the geometry (thickness, slope) of the geologic layers of the area.
ERT transects were positioned along the four sides of Salt Pond creating a rectangle surrounding the salt making area (Figure 14). Line BS was set up on 8/26/21 at 7:15 a.m. in a shore-perpendicular direction on the north side of the pond. 56 electrodes were deployed with a spacing of 0.3 m to achieve a high-resolution shallow image of the subsurface. Line BL was positioned on 8/26/21 at 9:00 a.m. at the same starting point and direction as line BS but with electrode spacing of 3 m, capturing a longer and deeper cross-section but at lower resolution. Line C was placed on 8/26/21 at 10:30 a.m. in shore-parallel direction at the east (mauka) side of the pond with 1.5 m electrode spacing. Line D was set up on 8/26/21 at 11:30 a.m. in a shore-perpendicular direction at the south side (parking lot side) of the pond, with 1.5 m electrode spacing. ERT measurements of all lines used a dipole-dipole array with a measurement time of 25 minutes. 0.3 m, 1.5 m and 3 m electrode spacing corresponded to estimated subsurface investigation depths of approximately 4 m, 20 m and 30 m.
To characterize subsurface tidal water exchange between the pond and ocean, 56 electrodes with 1.5 m spacing were positioned along a shore-parallel transect at the makai side (west) of Salt Pond but mauka of the sand berm (Line A on Figure 14). The resistivity cable was placed on 8/25/21 at 10:30 a.m. and repeated measurements without moving any of the electrodes were performed at 11:30, 12:30, 14:00, 15:30 and 17:00 hours , while the tide shifted from 0.15 to 0.55 m (MLLW as reported for Port Allen by tidesandcurrents.noaa.gov) (Figure 15 and 16).
Line E was deployed on 8/26/21 at 15:00 in an alongshore direction parallel to line A on the makai side of the pond and on the edge of the sand berm. Electrodes were spaced 1 m apart and imaging was performed at 15:15 and 15:45 during rising tide. All lines used a dipole-dipole array with a measurement time of 25 minutes.
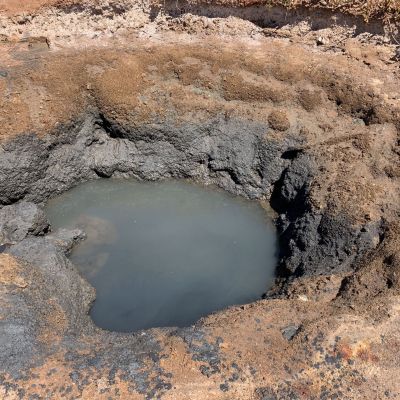
(Figure 13. Photograph of a puna (well) after draining, showing different clay layers.)
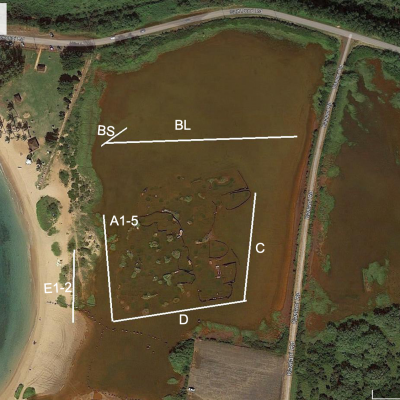
(Figure 14. Aerial photograph showing locations of electrical resistivity (ER) lines in Salt Pond.)
A SuperSting R8/IP unit (Advanced Geosciences Inc., AGI, Austin, TX, USA) with an 8-channel receiver, connected via an external switch box to a 168 m streamer (56 electrodes, spaced a maximum distance of 3 m apart) was used to obtain resistivity readings of the subsurface along selected transects. Electrodes along the resistivity cable were attached to steel stakes pounded 5 cm into the ground to assure good current penetration into the clay or sand. The quality of the data acquisition was controlled by the computer software which, before the start of measurements, checked electrode connectivity and contact resistances. We recorded bulk apparent resistivity (Ohm-m) of the geologic substrate using the electrode array. The apparent resistivity cross sections were then inverted to determine a model of the true subsurface resistivity distribution. Any systematic errors due to poor ground contact and random errors resulting in bad data points were removed before converting apparent resistivity values to a true resistivity model. Data were filtered using criteria of 5% root mean square error (RMSE) based on departure of modeled from measured apparent resistivity values and L2-norm statistic values below two. Apparent resistivity values were converted to true resistivity values using the AGI Earth Imager 2D resistivity and IP inversion software. We used the Smooth Model to execute the inversion; this model is based on Occam’s inversion [9].
Water samples were also collected in 20 mL centrifuge tubes for salinity measurements from punas and surface water pooling in the Salt Pond area. Salinities were measured using a refractometer after dilution by deionized water. Salinities were used to help interpret ER results.
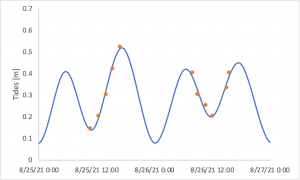
(Figure 15. Predicted tides at Port Allen NOAA tide station and corresponding times when measurements along the individual ERT lines were collected.)
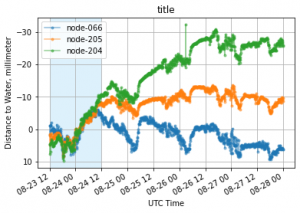
(Figure 16. Distance to water from sensors 66,205,204 over the time period corresponding to the ERT measurements on Aug 25 and 26, 2021. The records show tidal oscillations of about ~10mm, but an overall deepening trend at 204 (30mm) while average water level at 66 staying the same.)
Results
The resistivities obtained by the ERT method are not directly related to hydraulic properties of the substrate i.e., the method does not measure hydraulic conductivity of how fast water is able to move through a rock/sediment. Rather, ground resistivity is related to mineral content, porosity and water saturation of the rock as well as salinity of water in the pore spaces. As such, the ERT results provide bulk resistivity, however, they can be used to interpret the types of geological layers present in combination with other geological observations. This technique potentially allows for a differentiation of basalt, sand and clay, and/or layers filled with water of differing salinities.
ERT measurements along all lines produced good quality results with excellent contact resistance (20-90 Ohm in clays and 300-500 Ohm in sand), RMSE of 2-4% and L2-norm statistic values less than 1.8. Fewer than 10% of the data had to be removed before converting apparent resistivity values to a true resistivity model.
Objective 1 – Characterization of Geology: A prominent low-resistivity (<0.5 Ohm-m) layer sits on the top 3 m of all the resistivity profiles, independently on the line location (A, BL, C and D, Figure 14). While ERT smears boundaries of features so no small-scale (<ft) variation or changes would be discernable, the contact between the low-resistivity layer on top and high-resistivity layer beneath it seems uniform, i.e. it is parallel to the surface and the thickness of the low-resistivity layer does not vary, or at least is not identifiable at the sensitivity of parameters used in this investigation. Line BL for example, was the longest one extending 168 meters and shows a distinct and uniform low-resistivity layer extending from the makai to mauka ends of the salt pond. [10]
Based on observations of the geologic cross section exposed on the insides of the puna (dug wells), salinities observed in the puna (salinity of 60 to >100 ppt) and salt pond area (salinities up to 120 ppt), and observations of basalt outcrops in regions neighboring the salt making areas[11], we can conclude that the 3-m low-resistivity layer corresponds to clay layers filled with high salinity water (>60 ppt). The underlying, more resistive layers could be sand, or basalt filled with seawater. For example, resistivities of basalt fall within the observed range – dry basalt would be very resistive (>~1000 Ohm-m), freshwater-filled basalt has been observed to correspond to ~10-~100 Ohm-m, while seawater saturated basalt is <~5 Ohm-m[12],[13].
While line BL focused on large scale patterns at smaller resolution and extending to greater depths, line BS was set up at the same location but only extending 17 m and producing a much higher resolution image of the top ~4 m only. The BS line thus provides more detailed information on small-scale structures of the clay layers (Figure 19). Specifically, a ~0.1 Ohm-m resistivity layer sits in the top 0.5-0.75 m, which then transitions very sharply into a thin layer with ~0.3 Ohm-m resistivity. This thin, higher resistivity layer is not completely homogenous or continuous, presenting a more pronounced signature at the first 5 m of the line and then fading occasionally, but the layer persists throughout the length of line BS. Beneath it, the following layer is again of lower resistance (<~0.2 Ohm-m) and of considerable thickness extending down to about 3 m depth below surface.
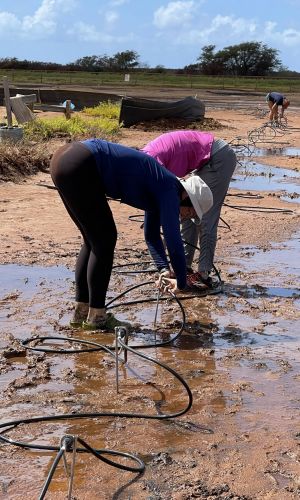
(Figure 17. ERT survey photograph.)
The BS ERT image (Figure 19) suggests that there is a 0.5-0.75 m thick low resistivity clay layer, underlain by a thin horizontal resistive layer at 0.75-1 m, and farther underlain by less resistive clay layer extending down to 3 m. This would match observations from push cores retrieved in the past by DOT from surrounding areas that show 2.5-3 m thick clay layers, with the upper 0.3-1.5 m being a very fine, smooth, red, iron-oxide-stained clay. And the second layer beneath it being a gray to black, anoxic, organic rich fine clay[14]. These also correspond to observed clay layers in the puna dug in the Salt Pond when water is drained from them and the walls are exposed. Another feature observed in the puna is a so-called “salt shelf”[15], perhaps an evaporite formed before the top clay layer was deposited in the Salt Pond. The salt shelf is not mentioned in the push core records collected outside of the pond area and may be a feature only present in the Salt Pond area where water is collected and trapped due to a slight depression in topography. The salt shelf is inferred to be present all along line BS, which is the only one having high enough resolution to confirm its presence so its extent beyond that line cannot be estimated.

(Figure 19. Line BS adjusted to maximize color scheme range.)
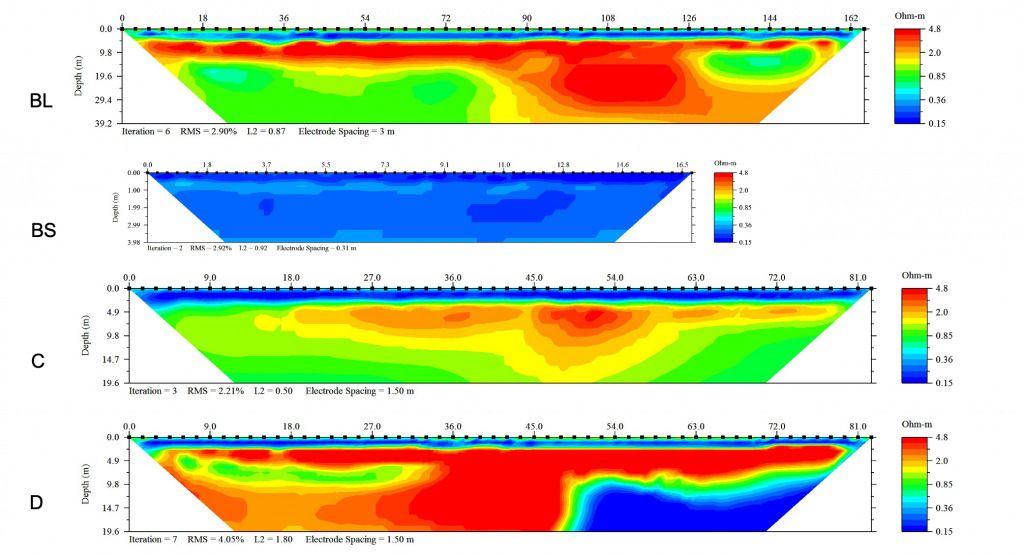
(Figure 18. The measured bulk apparent resistivity values were converted to true resistivity values using the AGI Earth Imager 2D resistivity and IP inversion software. All figures show true bulk resistivities and have the same color scheme range. Lines BL, C and D clearly show a 3-m thick low-resistivity layer on top of the cross sections (blue color on top of the cross sections) corresponding to clay layers in the Salt Pond.)
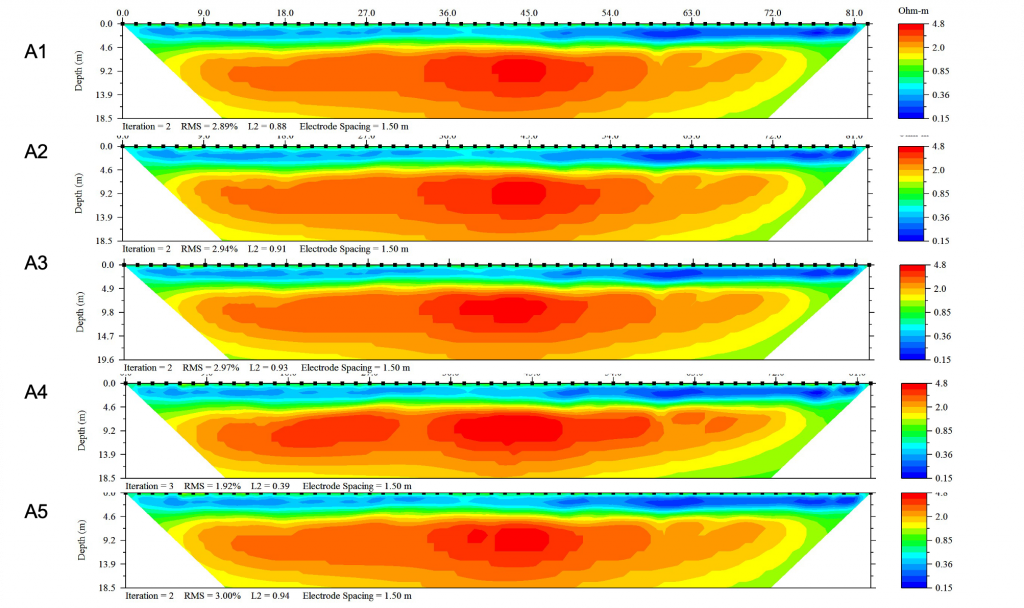
(Figure 20. True resistivity values along line A: A1 =11:30, A2=12:30, A3=14:00, A4=15:30 and A5=17:00.)
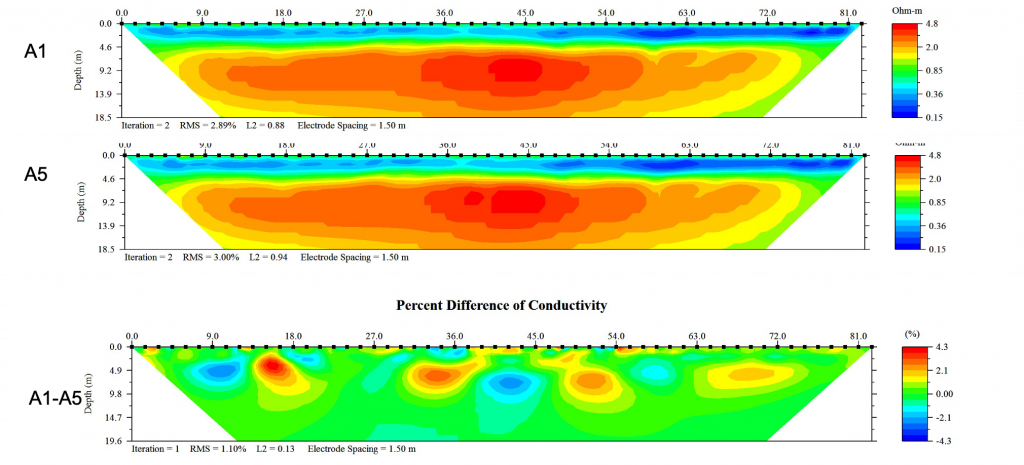
(Figure 21. Percent difference in conductivity between A1 and A5 resistivity.)
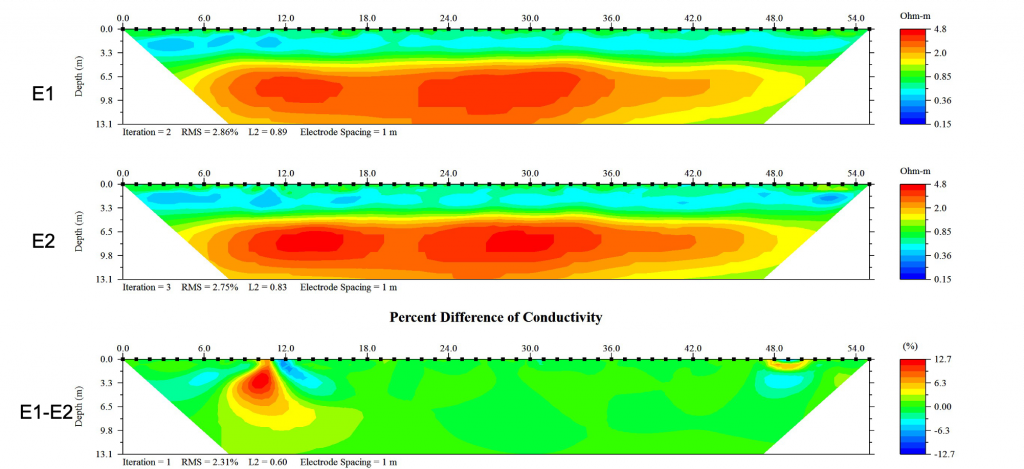
(Figure 22. True resistivity values along line E: E1 =15:15, E2=15:45. Percent difference in conductivity between E1 and E2 resistivity.)
Objective 2 – Characterization of pond-ocean water exchange: Tides affect a hydraulic gradient between the salt pond and ocean that drives water flow in and out of the pond. In the subsurface, the amount of water exchange is driven by Darcy’s law and is therefore dependent on the hydraulic gradient and the hydraulic conductivity of the geologic layers. Since salinity in the salt pond area is 2-3 times of that in the ocean (60-100 ppt as opposed to 35 ppt), any ocean water intruding in the subsurface would cause a temporary salinity decrease in the pores of the clay layers. If there is no change in salinity and saturation of pore spaces then no change in electrical resistivity is observed. This was attempted to be captured by measurements along line A.
Line A resistivity images captured similar profiles to all other lines discussed above – a 3-4 m thick low-resistivity layer underlain by a higher-resistivity layer that extends to the maximum depth of investigation (~20 m). The first ERT image at 11:30 (A1) captured higher low tide (0.15 m MLLW) and the ERT image from 17:00 captured higher high tide (0.55 m MLLW), with 3 other measurements spaced out in between these (Figure 20). Water level in the pond area over this time period changed 8-9 cm as recorded on node 66 (Figure 16). The AGI Earth Imager 2D resistivity and IP inversion software has a feature that allows 2 ERT images to be subtracted. The result is expressed as a cross section with % difference in conductivity between the two time points. The difference between measurements A1 and A5 show 4.3 % difference in a positive direction (increase in conductivity) and 2% in the negative direction (decrease in conductivity). The largest changes occur within the higher-resistivity layer (~4-10 m below surface), and at the very surface of the cross-section (Figure 21). These results suggest a very small change in salinity, in fact they may represent noise since differences change in both directions rather than conductivity just decreasing due to seawater intrusion. Hence seawater intrusion captured by this method is minimal suggesting absence of strong hydrologic connection between the ocean and the pond, at least at the level that could be captured using this ERT method.
Since it has been established that minimal seawater intrusion happens through the clay layers, we tested the possibility that ocean water is pushed through the sand berm located on top of the clay layers. Line E was set up on the margin of the sand berm on the makai side of the salt pond, where water was observed to trickle into the Salt Pond area. Images E1 and E2 were collected on a rising tide to see if seawater was pushed through the berm but due to time constraints, we only produced 2 images with minimal (0.5 hr) time lapse (Figure 22). The % difference in conductivity was obvious at two locations at 10-11 m and 48-50 m distance on the surface of the profile/ground. There was up to 12% increase in conductivity, which makes sense if seawater fills pore spaces in the otherwise unsaturated/partially saturated highly resistive sand.
The tidal experiment along line A reveals that very little salinity change happens within the clay layers over a period of a tidal cycle. This may be interpreted as little to no seawater intrusion or groundwater drainage from the coastal aquifer represented by the clay layers. These geophysical results are also supported by the low or absent discharge rates determined by the geochemical methods described above. Geophysical observations on the sand berm along line E however confirm water flow so a possible pathway for water intrusion from the ocean to the pond area through the sand of the berm sitting on top of the clay layers. This latter flow may be of significance in keeping the pond flooded especially under future sea level rise/swell events.
SELF POTENTIAL GEOPHYSICAL SURVEY
Methodology
In August 2022 researchers from the Hawaii Groundwater and Geothermal Resources Center conducted a self-potential survey, for the purposes of characterizing permeability in the Salt Pond and surrounding terrain. The team completed 229 measurements during 3 survey days. The survey points are shown in the map in Figure 23.
The self-potential method (SP) measures the naturally occurring electric potential variability, with such variations driven by movement of water in the subsurface. As water migrates through the subsurface it drags electrical charge with it. The flux of charges results in an electric field or potential that we measure[16]. This movement can be at the very small porescale due to movement of positive charges within the porespace or at a larger scale due to movement of charge with groundwater flow and will be positive in the direction of flow. Measuring the movement of charge is an indirect qualitative measurement of permeability with positive values related to upward flow and negative values associated with downward flow. Values near zero indicate a lack of upward/downward flux. SP is not a measure of electrical resistivity but assists in the interpretation of the electrical resistivity cross sections presented in the preceding section.
We employed the technique described in Barde-Carbusson, et al., 2021[17]. It requires the use of two non-polarizing electrodes connected by a wire. Typically, the electrode is placed in a small hole (~10 cm). To ensure no damage occurred this was not practical in the salt making area. Because of the high clay content in Salt Pond the contact resistance was quite low (20 – 200 Ohms), and the measurement was successfully made by holding the electrode to the surface. One electrode remains in place at the beginning of the profile and the other is moved in increments of 20 m expanding up to a total profile length of 300 m, which typically gives good resolution while allowing reasonable data collection times. Location was recorded using a handheld GPS. The profiles were connected into loops so that a measurement could be repeated, and then became a reference to correct data for drift. The ocean can also be used for reference at an endpoint of a profile because we know that the SP value of sea water is 0 mV. The drift correction is easily done in a spreadsheet, and the results can be plotted in contouring software.
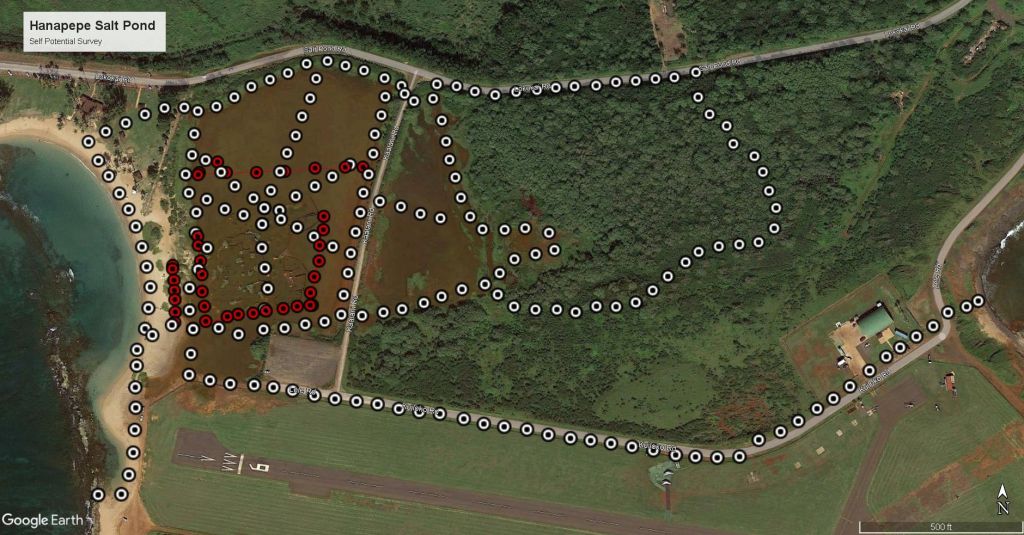
(Figure 23. Geophysical Survey Map. Shown in white are the locations of the self potential (SP) measurements. In red are the electrical resistivity tomography (ERT) lines, red dots indicate 10 m increments along the ERT lines.)
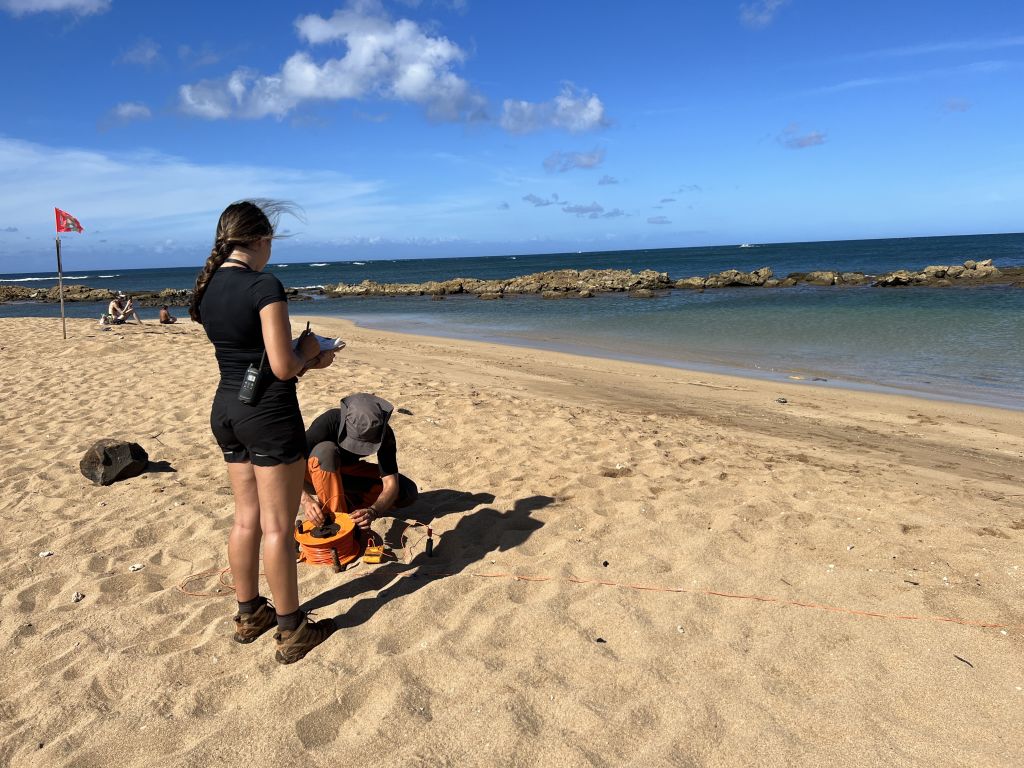
(Figure 24. Photo of SP survey on Salt Pond Beach.)
Results
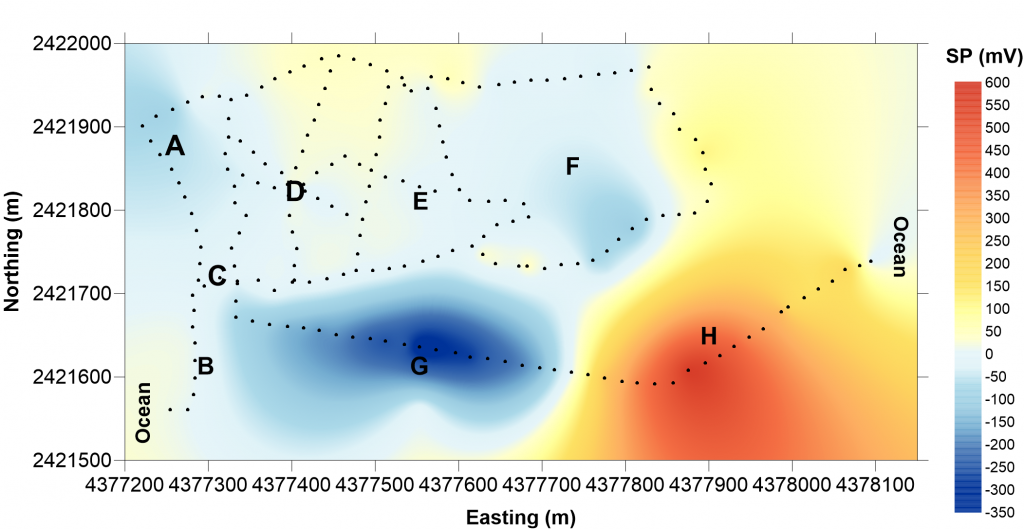
Figure 25. Map showing the final drift corrected results from the SP survey. Warm colors are associated with high positive SP values (in mV) and upflow conditions while cool colors are indicative of lower SP values, and downflow conditions. Areas A, B and C are comprised of beach dunes. D indicates the active salt making area. Area E is an inactive part of the Salt Pond east of the Kaalani Rd. The loop that went through the forested area is identified as Area F. The profile marked with G and H were collected along Kuiloko Rd.
Figure 25 shows the SP profiles and results across the beach dunes, the campground area of Salt Pond Beach Park, Salt Pond, and the forested area to the east. Figure 25 can be referred to for orienting the SP signal of areas A through H with the beach, ponds, forested area, and campground. The active salt making area (labeled D in Figure 25) exhibits SP values between 0 and 60 mV. There is also a shore parallel profile that runs from the ocean on the west to the ocean on the east following Lele and Kuiloko Roads with high variability from -250 mV at the near the end of the airstrip on the west (G) rising to 550 mV where Kuiloko Road curves to the northeast (H) and dropping to 100 mV approaching the east and then zero mV at the ocean. The beach’s dunes show -40 mV readings (Area A) but range above 0 mV in the area marked C, and rise to 60 mV adjacent to the Lokokai/Salt Pond Rd.
It is important to understand that unlike ERT, which provides a two-dimensional quantitative model of electrical resistivity, the SP method as applied here provides qualitative information about subsurface flow. Data were collected at the points shown in Figure 25. The data were then gridded and contoured, such that where there is no data, the map is less well resolved. An example of this is the ~ 100 mV SP in the far northeast corner of the map in Figure 25. There is no data to support these values as they are distal to the SP line that went through the forested area. The SP data were of high quality and consistent with our field observations of location of dunes, clay, sea water and rocky coastline.
The contrast in values between the dunes and the salt making area is indicative of higher meteoric water infiltration at the beach than at the pond. This is natural and expected as sand is more permeable than clays. What is evident and of interest is that where the dunes were compacted by past vehicle traffic and have not yet fully recovered (Area C and the unvegetated dunes between the Salt Pond and the ocean), the SP values indicate less permeability than the negative SP values along the rest of the beach profile. This is consistent with conditions that can favor wave overtopping and flooding of the Salt Pond. Area C is collocated with ERT Line E. The northern end of ERT Line E (See Figure 14) exhibited an approximately 12% change in electrical resistivity (Figure 22). The SP values of the Salt Pond (near zero mV) are indicative of low permeability, consistent with the presence of clays. The slightly higher positive values within the salt pond adjacent to Lokokai Road indicate that the northern portion of the salt pond is susceptible to groundwater flow coming from the north. The Salt Pond to the east of Kaalani Road shows near zero SP values. This is consistent with our field observations of abandoned punas and salt beds.
Area E encompasses an open area near the current salt making area. The SP signals on the western portion are similar to the values adjacent to Kaalani Rd in the active salt making area. Moving eastward across Area E the SP value becomes more negative, consistent with the transition from red iron-oxide-stained clay to gray/ black anoxic, organic rich clay, and finally dry vegetated sands on the eastern edge of the area. The clays and low permeability control the ability of water to be absorbed into the subsurface, implying that flooding impacts will be long duration. This is consistent with paʻakai practitioner’s knowledge of long duration recovery times following rainfall or overtopping flood events. With evaporation rates of four to six weeks for approximately six inches of water in a clay lined salt bed, during active salt making activity[18]. It is also likely that evaporation is a driver of recovery from flooding events. The slightly higher positive SP values along the north boundary of the Salt Pond imply that any contaminant issues from the road, anthropic activities to the north or Salt Pond Park could impact the salt making area. Therefore, the Salt Pond is vulnerable to being affected by any change (climatic or anthropic).
We can conclude that the source of the high salinities in the Salt Pond is shallow as SP values are near zero compared to the eastern side of the peninsula. This is consistent with the pa`akai practitioner knowledge and description of the salt shelf structure. A key question is why is there higher hyper salinity within some puna as compared to others? In a project with similar conditions of infiltration an electrical resistivity study showed that while infiltration existed drainage did not, such that water was trapped in the subsurface and only exhibited slight movement[19],[20]. In the case of the Salt Pond we observed highly saturated clay layers with fine scaled interbedding. The clay retained significant saturation. These findings help to explain the observed high salinities. With low drainage rates, salts are able to further saturate the water in the wells reaching high concentration levels. A variability in clay volume and trapped water down to the salt shelf could cause variable salinities at punas throughout the Salt Pond.


