APPENDIX 1. Water Level Sensor Details

Link to GAIA GPS Shared folder – https://www.gaiagps.com/public/RcYcxuc1cuHNDw2J2rqlXGzF
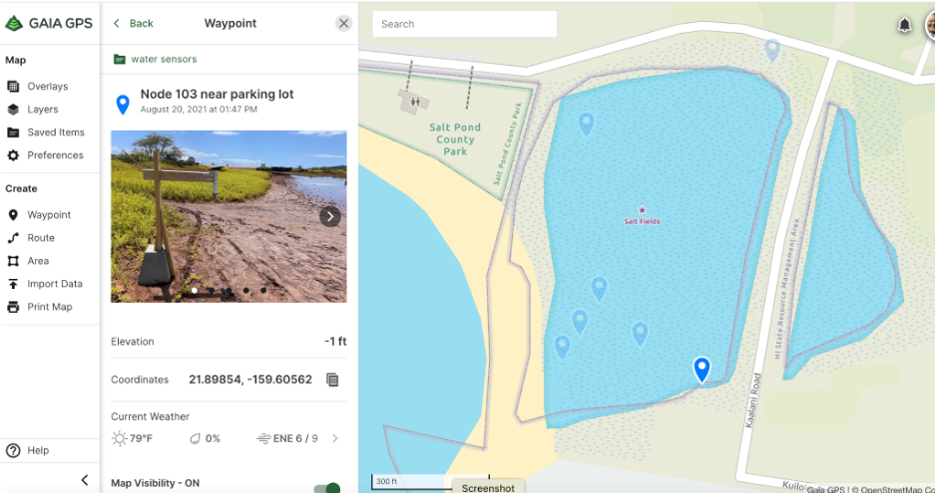
Water Level Sensors were placed in the field on Aug 20, 2021. Photos in this appendix share more info on the specific coordinates for each node/water level sensor.
Water level sensor details: node-066
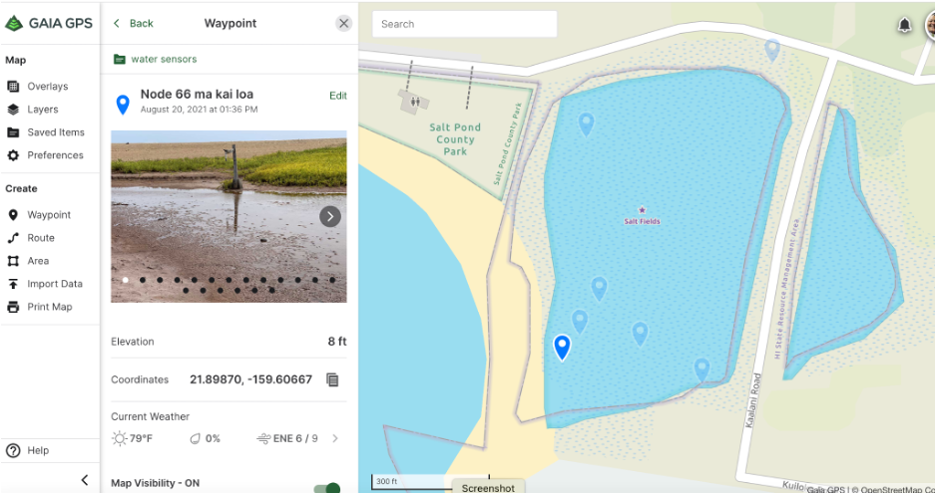
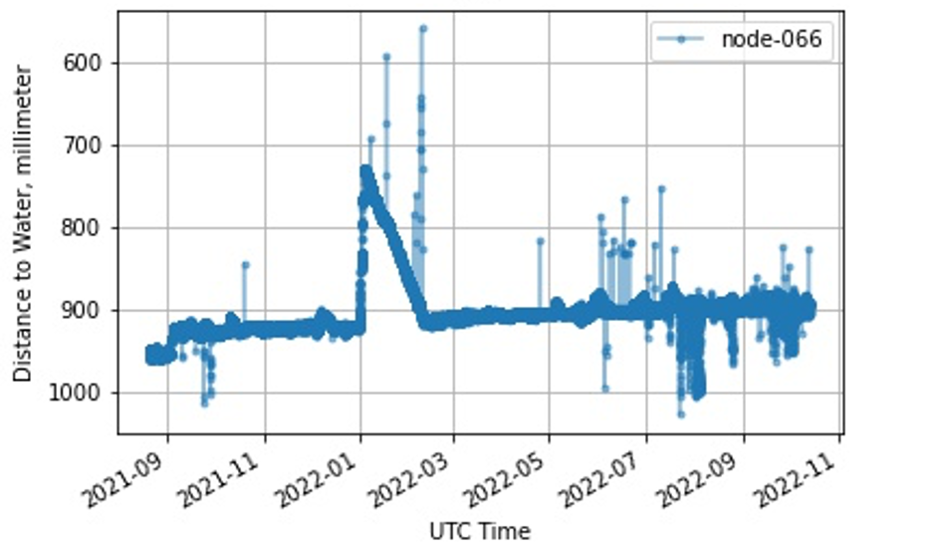
Raw data for node-066 for the study duration is available at:
Water level sensor details: node-205
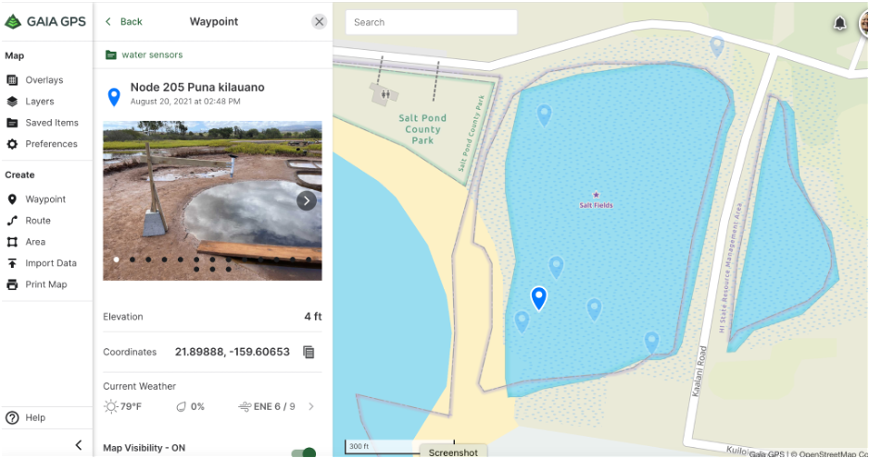

Raw data for node-205 for the study duration is available at: http://grogdata.soest.hawaii.edu/usa_hi_hanapepe_saltpond/dataportal/node-205/d2w/?begin=1629777600.0&end=1665633600
By May 2022, excessive noise in the data makes interpretation difficult, possibly due to the sensor installation falling out of vertical and resulting in errant signals.
Water level sensor details: node-204
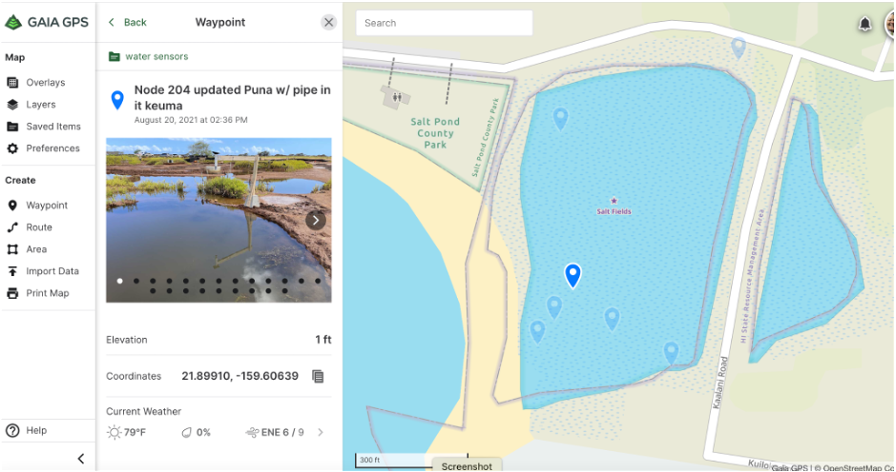
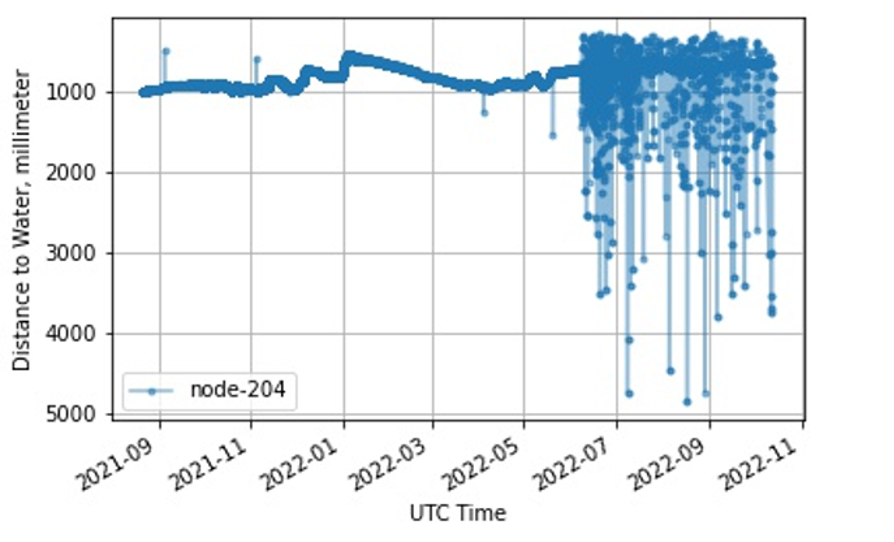
Raw data for node-204 for the study duration is available at: https://grogdata.soest.hawaii.edu/usa_hi_hanapepe_saltpond/dataportal/node-204/d2w/?begin=1629777600.0&end=1665633600
By June 2022, excessive noise in the data makes interpretation difficult, possibly due to the sensor installation falling out of vertical and resulting in errant signals.
Water level sensor details: node-229
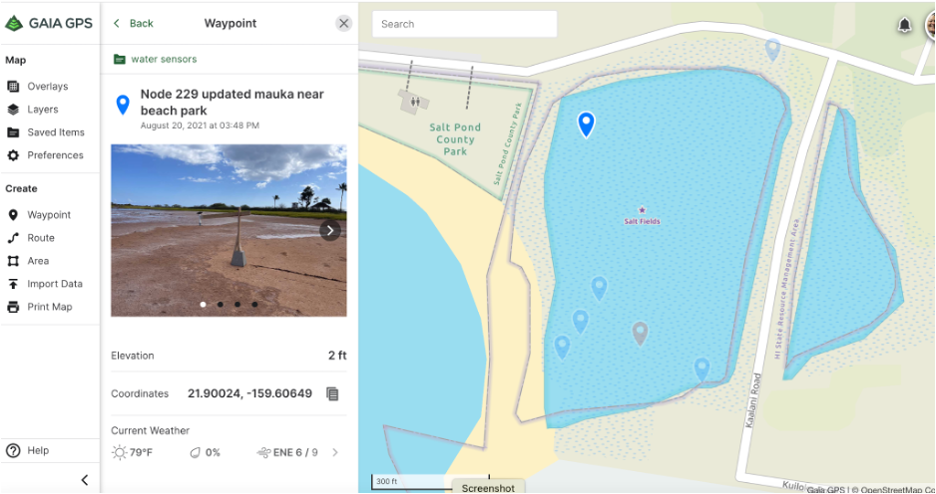
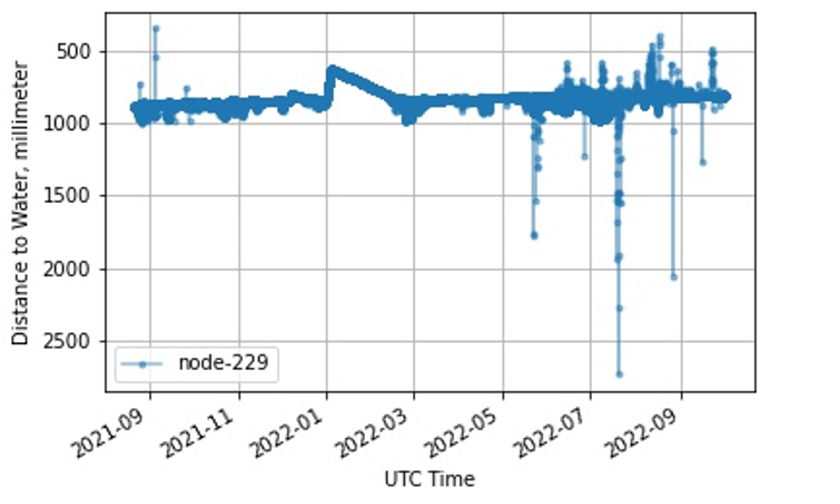
Raw data for node-229 for the study duration is available at: https://grogdata.soest.hawaii.edu/usa_hi_hanapepe_saltpond/dataportal/node-229/d2w/?begin=1629777600.0&end=1665633600
Water level sensor details: node-186
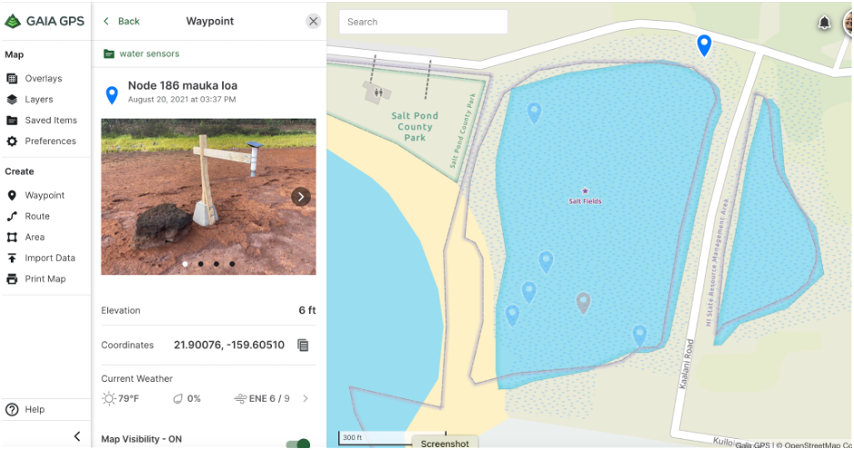
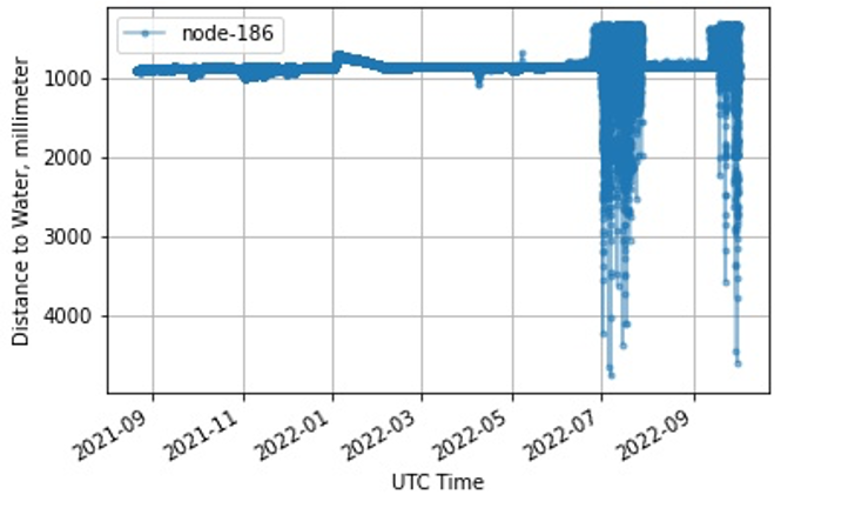
Raw data for node-186 for the study duration is available at:
https://grogdata.soest.hawaii.edu/usa_hi_hanapepe_saltpond/dataportal/node-186/d2w/?begin=1629777600.0&end=1665633600. It is unknown what caused excessive noise in the data during July and late September 2022, possibly due to the sensor being moved or falling out of vertical and resulting in errant signals.
Water level sensor details: node-235
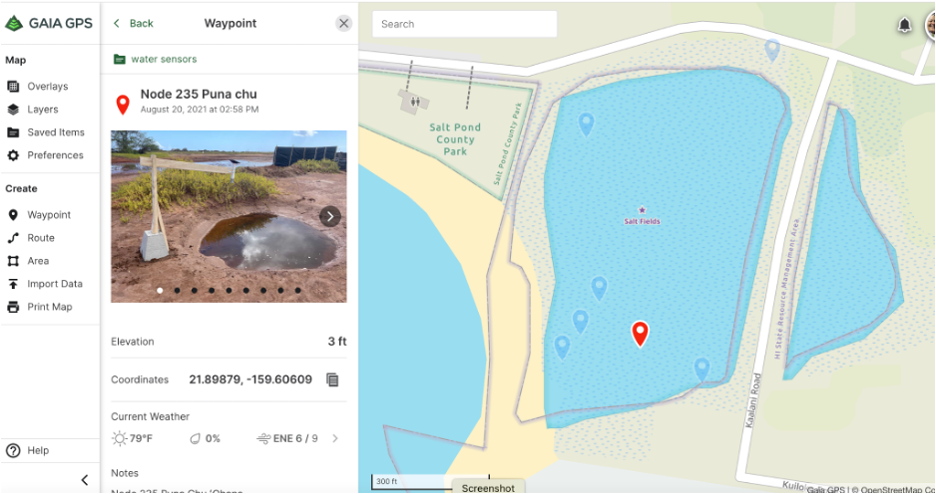
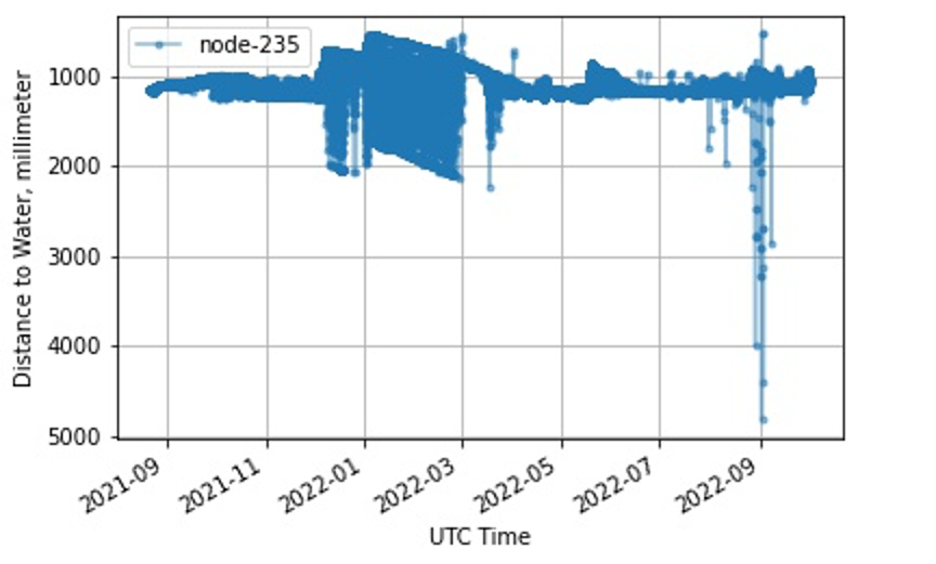
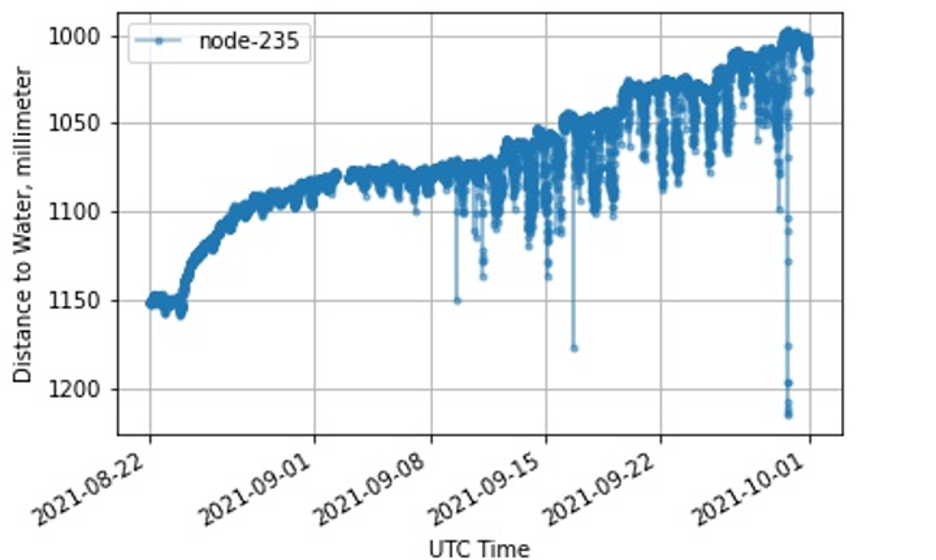
Raw data for node-235 for the study duration is available at:
https://grogdata.soest.hawaii.edu/usa_hi_hanapepe_saltpond/dataportal/node-235/d2w/?begin=1629777600.0&end=1665633600. Data from node-235 are quite noisy following initial installation, potentially from sensor malfunction or the installation being moved, causing misalignment with vertical. Interestingly, water level in the puna appears to have increased by 150mm over the first two months of deployment, but unfortunately this cannot be definitively concluded without additional corroborating data because of the amount of noise and possibility of sensor installation moving/sinking into the mud. Future studies should conduct initial RTK elevation surveys, and should repeat the surveys annually, or at least at the conclusion of the study.
Water level sensor details: node-103
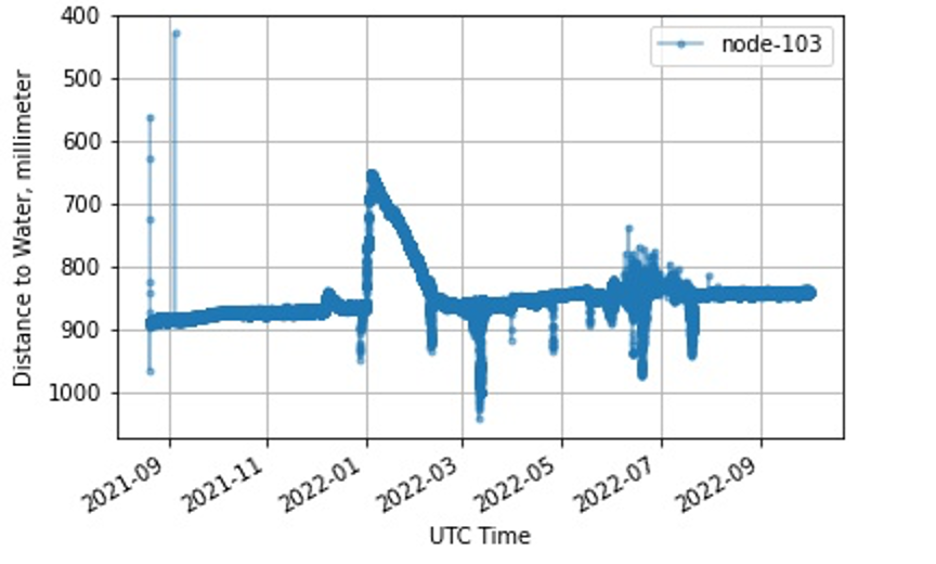
Raw data for node-103 for the study duration is available at:
https://grogdata.soest.hawaii.edu/usa_hi_hanapepe_saltpond/dataportal/node-103/d2w/?begin=1629777600.0&end=1665633600. Node-103 performed well during the duration of the deployment, but shows some unexplainable noise in July 2022, possibly due to the sensor installation falling out of vertical and resulting in errant signals. Long-term decrease in the distance to water measurement over the duration of the study is likely attributable to movement of the sensor installation, i.e., sinking of the sensor bracket into the mud, as the air gap measurement between sensor and soil surface was ~884mm in August 2021, and had decreased to ~840mm by October 2022. In the absence of rigorous RTK surveys at the beginning and end of the study, this could potentially be verified on site by careful inspection of the sensor mount base and comparison of any installation photos with current photos.


